As you might have noticed if you are reading this, I have a blog where I tend to publish on a weekly basis. As most people putting things out into the wilderness of the web, I've been curious to know if anyone was actually reading and finding value from those articles. I also wanted to make sure that whichever analytics and data I would be collecting, would be respecting my readers privacy.
And so, our adventure begins!
Build vs Buy
Whenever you need a new tool or service, it is important to ask yourself if it is worth building it, or if someone else already built something similar to what you had in mind. In this case, I wanted to use a privacy-first analytics tool that would be free or with a very low price tag, as I was only planning to using it for my blog, and so far, it's far from being the most popular website on the Internet (soon though, maybe?).
Out of the gate, I ruled out tools like Google Analytics because of the data they collect from users. Also, I really only care about how many times my articles are read, and I don't need any crazy funnel analysis and other segmentation shenanigans. Great privacy-focused managed options are Fathom, Plausible, Pirsch, and Fugu. They all have at heart user's privacy, but were a bit too pricey for my use case (starting at $14/month for Fathom, $9/month for Plausible and Fugu, and $5/month for Pirsch). Note that Plausible, Fugu, and Umami are open source and offer a self-hosting option, but if I am going to be self-hosting my analytics tool, why not just host my own?
Ultimately, I decided to build yet another web analytics tool for the following reasons:
- It's a great learning opportunity.
- It will allow me to showcase my latest skills (my latest completed open source side project is already a couple of years old).
- It will cost me less than some of the available managed options.
- If I were to just use an existing tool, we most likely wouldn't have this very blog post!
And so, our adventure continues!
Philosophy
Let's start by reiterating the core principles on to which the analytics tool will be build upon:
- Privacy-first, meaning that we won't be collecting any trackable data from visitors.
- Open source, as I deeply believe in the values of open source and want to allow fellow developers to audit the code and self-host.
- Free tier, as this was the main reason why I decided that my time was worth less than ~$10/month.
As open source and free tier are actually quite self-explanatory, let's dig a bit deeper on the privacy-first part. If you look at a usual analytics service, they will track individual users and store data related to each user individually. That is the approach for Google Analytics, but also at Fathom. In the later case, they anonymize data use hashing to protect user's privacy. Plausible and Fugu take a different approach, where they track aggregated data. In the case of Plausible, they still do some individual tracking for repeated visits in a day.
When you look closer at the needs behind simple web analytics cases, aggregated data is often enough to provide the data points necessary. Fugu has a nice article about why it doesn't track unique users, and I second most of those points:
- Privacy is a human right.
- Anonymized data can still used to analyze behavior.
- Most times, aggregated data will give you the answers you are looking for.
Tools like Fathom and Plausible provide information such a the country from which users viewed your website. Those data points are usually inferred from the IP address of the users visiting your website. IP addresses are considered personally identifiable information (PII). To go a step further in terms of privacy, the analytics tool I'm building won't use anything that is not part of the request from the browser. That means that it won't be able to track countries for example, and it will only use information sent by the headers and in particular user agent client hints (such as browser information), or present in the browser (such as referrers).
Alright, so now that we have laid down the main constraints of our solution, let's look at the implementation needed to support it!
Implementation
Usually, when looking at building something new, I like starting with the simplest system I can think of. More often than not, the simplest system can scale quite nicely, because, let's be honest, none of my side projects is going to reach mass adoption!
For our web analytics platform, we need a few pieces:
- A script that will be loaded on websites to be tracked, which will send information about page views
- An API that will intake those pings from the script
- A database that will store the aggregated data from those pings
- A dashboard to visualize the aggregated data
For simplicity, we will gloss over all the bits about account creation, user authentication, and other admin stuff.
Tracking script
To track events on websites, we either need to serve the routes (à la Vercel or Cloudflare), or we need to embed a tracking script on them. For simplicity, we will provide users with the script tag needed to load the script. The script will then be served from our domain.

For now our system is very simplified. Every client's browser downloads the tracking script from our domain as a static asset, then communicates with our platform when the user navigates to a new page within that website.
Ideally the static assets would be served from a file storage solution with a CDN. In AWS, that would be storing the script in S3, and serving it with CloudFront from example. In our case, for simplicity, the script is served by our server directly.
The script itself is embedded using the following tag:
<script defer src="https://fantomely.com/sdk/browser.js" data-fantomely data-h="https://fantomely.com" data-k="PUBLIC_KEY"></script>
And its content is so small, it can fit right here:
window.addEventListener("DOMContentLoaded", function () {
  const script = document.querySelector("script[data-fantomely]");

  if (!script) {
    return;
  }

  const API_URL = `${script.getAttribute("data-h")}/api/event`;
  const PUBLIC_KEY = script.getAttribute("data-k");

  if (!API_URL || !PUBLIC_KEY) {
    return;
  }

  function sendPageView() {
    fetch(API_URL, {
      method: "POST",
      body: JSON.stringify({
        k: PUBLIC_KEY,
        p: window.location.href.slice(0, 280),
        r: document.referrer.slice(0, 280),
      }),
    }).catch(() => null);
  }

  if (typeof window !== "undefined") {
    sendPageView();

    if (window.history.pushState) {
      const pushState = window.history.pushState;
      window.history.pushState = function (...args) {
        sendPageView();
        pushState.apply(window.history, args);
      };
    }

    window.onpopstate = function () {
      sendPageView();
    };
  }
});
Even though the script is quite small, there are a few interesting parts.
We leverage data- values to pass the API base URL (data-h), which can be changed when self-hosting. We also use the data- attribute to pass in the public key (data-k), which is unique for each website and is used to link the tracking event back to the correct account.
As we based our data on user agent client hints, the body of our HTTP request is quite minimal and only contains:
- the public key (
k) - the current page's URL (
p) - the referrer (
r)
To support single page applications (SPAs), we need to monkey-patch window.history.pushState. That is due to the fact that SPAs do their routing on the client, hence they will load and execute the tracking script only once. To take into account when a user navigates back, we also need to listen to the onpopstate event.
Tracking API
To ingest all the tracking events, we surface a simple REST API. This works fine as long as the platform is not used by major websites, but clearly won't scale at some point. If this becomes successful and this architecture cannot keep up, which will be a good problem to have, we might look at building a queuing pipeline instead of a single REST API.
The API receives the event details, parses the user agent client hints, and saves the new event's data in aggregate. We will go into more depth as how the events are stored in the database, but we leverage Prisma's atomic number operations to ensure atomicity of aggregated updates on event counts.
import type { ActionFunction } from "remix";

import { db } from "~/utils/db.server";
import { parseClientHints } from "~/utils/useragent.server";

const KEYS = {
  PATH: "p",
  PUBLIC_KEY: "k",
  REFERRER: "r",
};

export const action: ActionFunction = async ({ request }) => {
  const now = new Date();
  const year = now.getUTCFullYear();
  const month = now.getUTCMonth() + 1;
  const day = now.getUTCDate();
  const hour = now.getUTCHours();

  const origin = request.headers.get("Origin");
  const payload = await request.json();

  const useragent = parseClientHints(request);

  // Website
  const publicKey = payload[KEYS.PUBLIC_KEY];

  const website = await db.website.findFirst({
    where: { publicKey },
  });

  if (!website || website.url !== origin) {
    throw new Response("Error while ingesting event. Website not found.", {
      status: 404,
    });
  }

  // Path
  const formattedPath = website.ignoreQueryString
    ? payload[KEYS.PATH].split("?")[0]
    : payload[KEYS.PATH];

  let path = await db.path.findUnique({
    where: { path: { value: formattedPath, websiteId: website.id } },
  });
  if (!path) {
    path = await db.path.create({
      data: {
        value: formattedPath,
        websiteId: website.id,
      },
    });
  }

  // Browser
  ...

  // Platform
  ...

  // Period
  ...

  // Referrer
  ...

  // Upsert event
  await db.event.upsert({
    where: {
      website_period_path: {
        websiteId: website.id,
        periodId: period.id,
		pathId: path.id,
        ...
      },
    },
    create: {
      websiteId: website.id,
      periodId: period.id,
	  pathId: path.id,
	  ...
      count: 1,
    },
    update: {
      count: { increment: 1 },
    },
  });

  return new Response("ok", {
    headers: {
      "Access-Control-Allow-Origin": website.url,
    },
  });
};
To be able to segment events in the dashboard, we also save the events based on those segments (namely: period, path, browser, platform, referrer).
Finally, we return an "ok" response back to the tracking script, with the appropriate "Access-Control-Allow-Origin" header for Cross-Origin Resource Sharing.
Data Model
Let's take a closer look at the database that powers the platform!
As a mostly frontend-focused software engineer, I had no idea that the database world was going through a phase of sprouting technologies, very similar to what has happened with frontend web frameworks (and currently with frontend tools). Therefore, a non-negligeable chunk of my time was spent researching and understanding different database offerings. I looked in TimescaleDB, Supabase, PlanetScale, MongoDB, ScyllaDB, and more, but ultimately decided to stick with a more traditional approach: good old PostgreSQL.
The choice of using a relational database for this project is questionable, but here is how I ended up modeling the data:
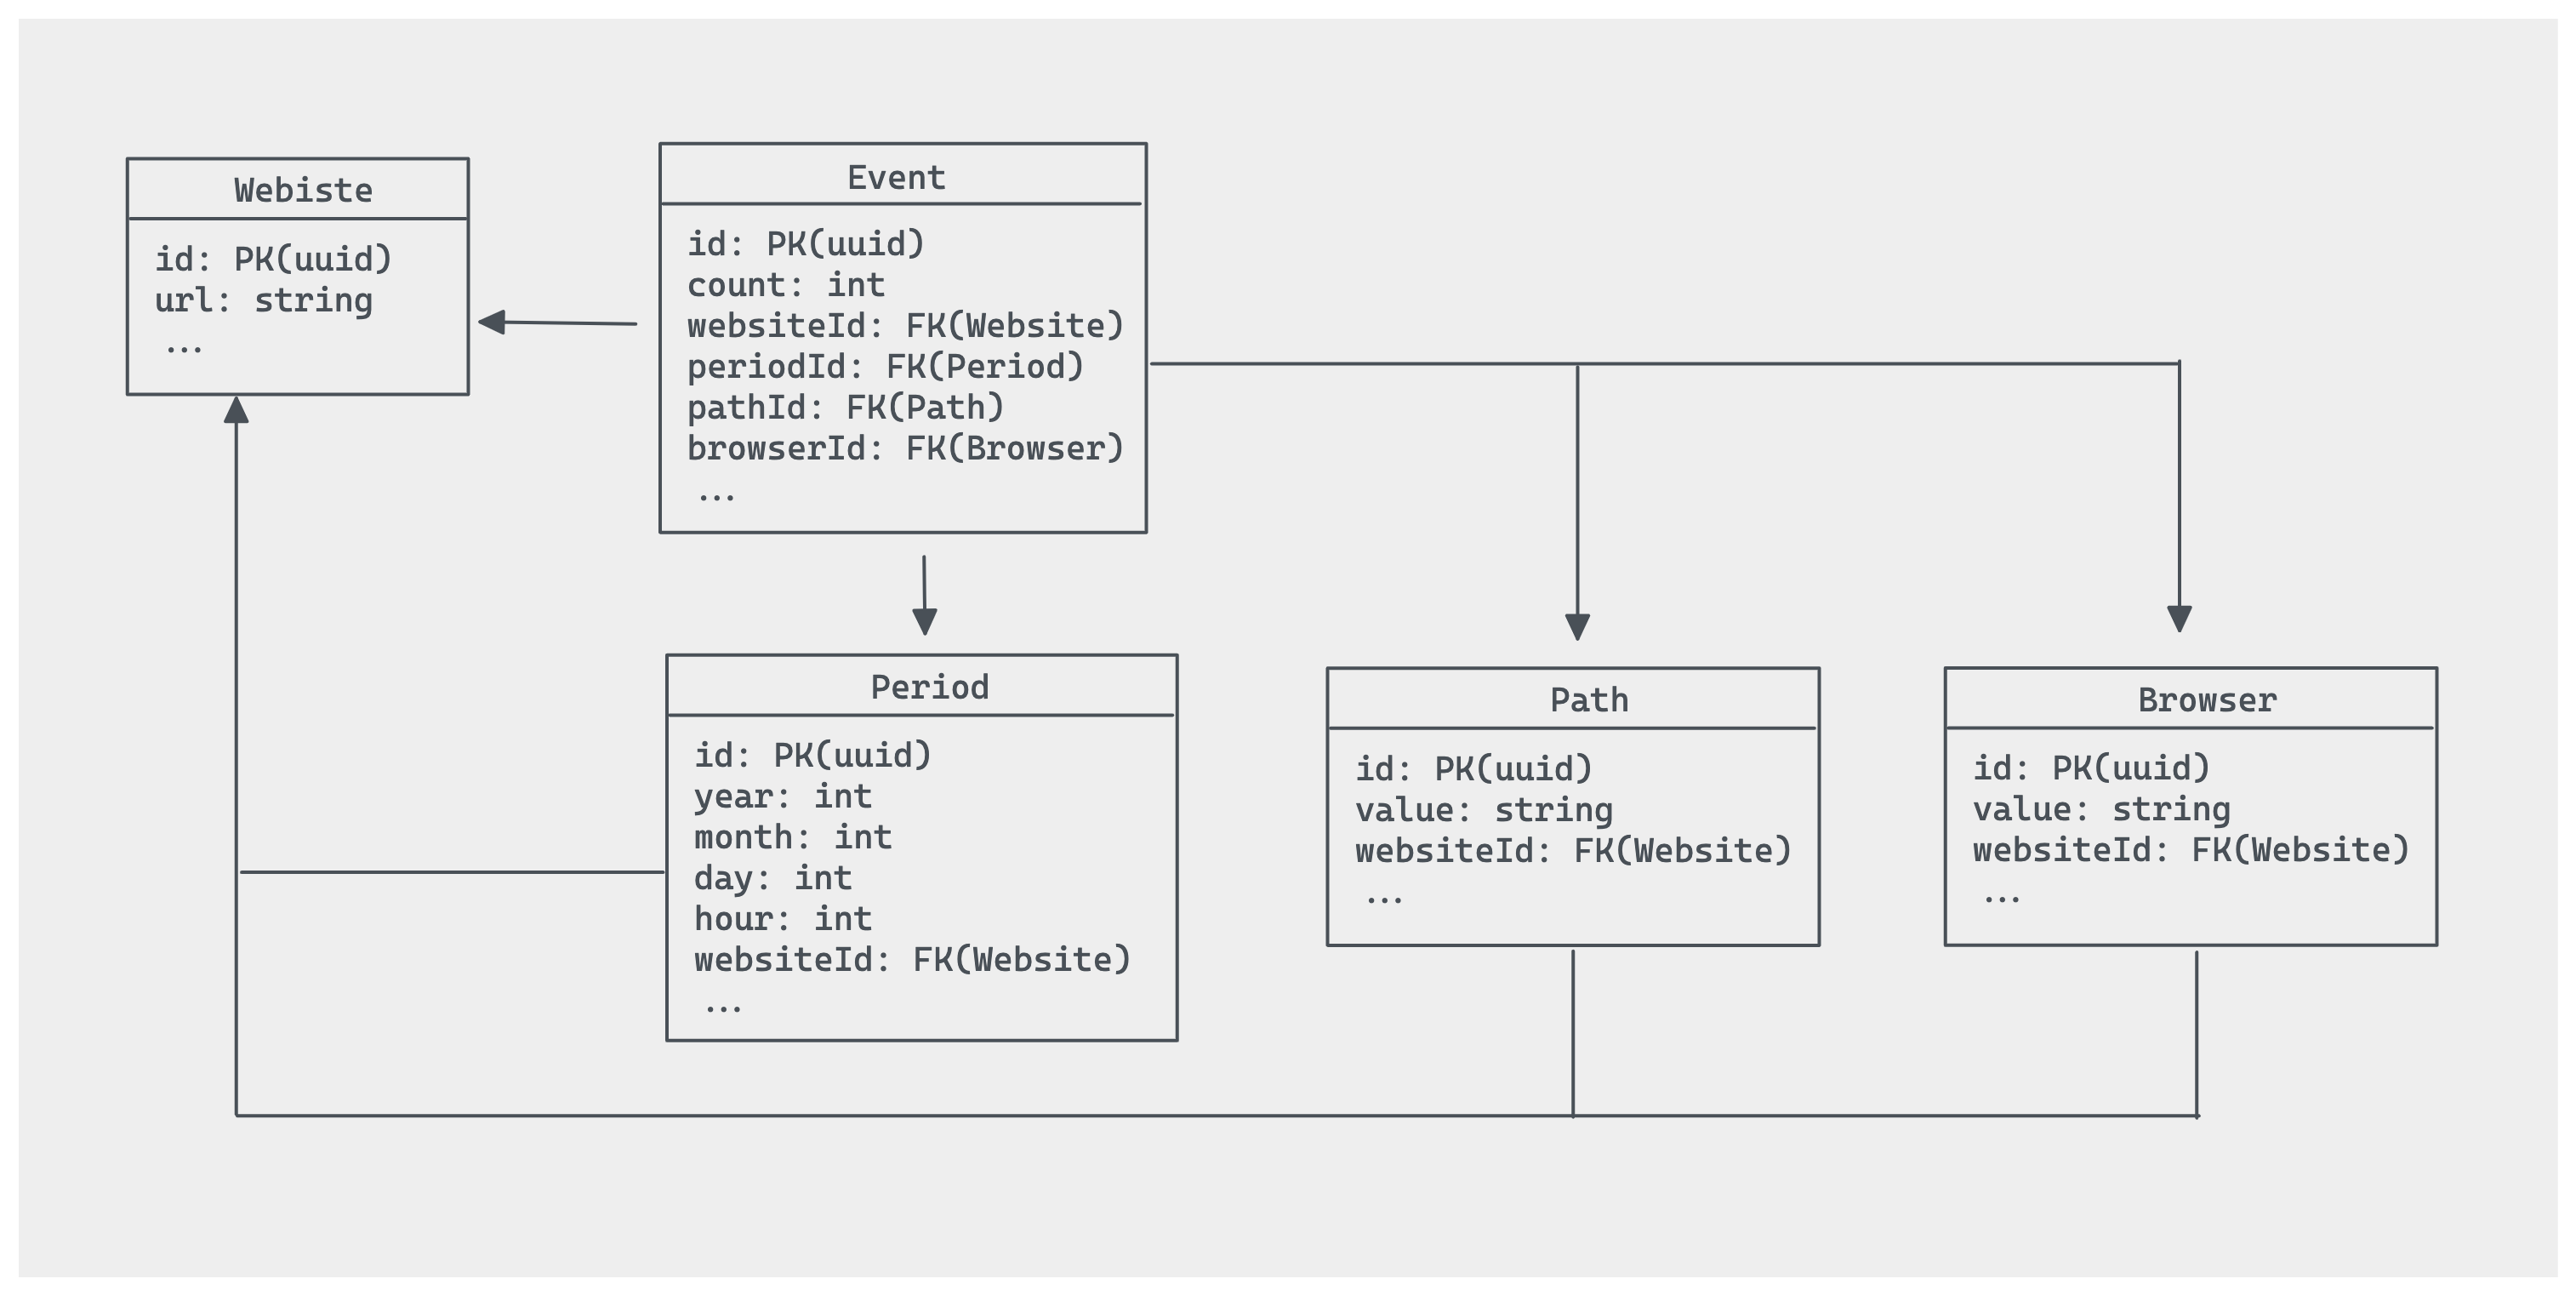
The Website table probably don't need much explanation, but the Event table is already quite interesting. As we are storing events as aggregates, we only really need to keep track of a count field per row. Events are then aggregated by the different fields we want to segment the data into. This is useful for presenting the data in a meaningful way in a dashboard (more on that later!). So here we segment event by Period, Path, and Browser.
The Period table stores different hourly values, as that is the smallest level of detail we decided to design our aggregate on. The link back to a specific Website might seem redundant here, but it allows us to add uniqueness constraints at the database layer. The fields year, month, day, and hour are stored as integers to simplify handling dates and timezones. Basically, they represent a moment in time in UTC. Timezones and further aggregates by days are performed when generating the data for the dashboard.
The Path and Browser tables have a similar philosophy, albeit using a simple value field to store any relevant information (in the case of Path it'll be a URL, and for Browser it'll be the browser name).
Now let's have a closer look at some constraints added to the tables:
-- CreateIndex
CREATE UNIQUE INDEX "Event_websiteId_periodId_pathId_browserId_key" ON "Event"("websiteId", "periodId", "pathId", "browserId");

-- CreateIndex
CREATE UNIQUE INDEX "Period_year_month_day_hour_websiteId_key" ON "Period"("year", "month", "day", "hour", "websiteId");

-- CreateIndex
CREATE UNIQUE INDEX "Path_value_websiteId_key" ON "Path"("value", "websiteId");

-- CreateIndex
CREATE UNIQUE INDEX "Browser_value_websiteId_key" ON "Browser"("value", "websiteId");
The resulting data model is also fairly easily extensible. For example, adding new segmentation values for events can be achieved by creating a new table similar to Path or Browser, and updating the unique index on Event to incorporate the foreign key of the new table.
For example, let's say that we also want to track referrers of the page views. We can achieve that with the following code:
-- DropIndex
DROP INDEX "Event_websiteId_periodId_pathId_browserIdkey";

-- AlterTable
ALTER TABLE "Event" ADD COLUMN     "referrerId" TEXT;

-- CreateTable
CREATE TABLE "Referrer" (
    "id" TEXT NOT NULL,
    "value" TEXT NOT NULL,
    "websiteId" TEXT NOT NULL,
    "createdAt" TIMESTAMP(3) NOT NULL DEFAULT CURRENT_TIMESTAMP,
    "updatedAt" TIMESTAMP(3) NOT NULL,

    CONSTRAINT "Referrer_pkey" PRIMARY KEY ("id")
);

-- CreateIndex
CREATE UNIQUE INDEX "Referrer_value_websiteId_key" ON "Referrer"("value", "websiteId");

-- CreateIndex
CREATE UNIQUE INDEX "Event_websiteId_periodId_pathId_browserId_referr_key" ON "Event"("websiteId", "periodId", "pathId", "browserId", "referrerId");

-- AddForeignKey
ALTER TABLE "Referrer" ADD CONSTRAINT "Referrer_websiteId_fkey" FOREIGN KEY ("websiteId") REFERENCES "Website"("id") ON DELETE RESTRICT ON UPDATE CASCADE;

-- AddForeignKey
ALTER TABLE "Event" ADD CONSTRAINT "Event_referrerId_fkey" FOREIGN KEY ("referrerId") REFERENCES "Referrer"("id") ON DELETE SET NULL ON UPDATE CASCADE;
As this project was mainly meant to track page views on this very blog, some of the design decisions listed above might not be that scalable, but again, I only register about 20-30 page views per day, so it really is quite fine!
Dashboard
Collecting data (in a privacy-first manner) is great! Displaying that data in a meaningful way is even better! That is what the simple dashboard built into the platform tries to achieve.
That is a screenshot of the dashboard of events for this very blog. It is using ApexCharts.js to render the graph.
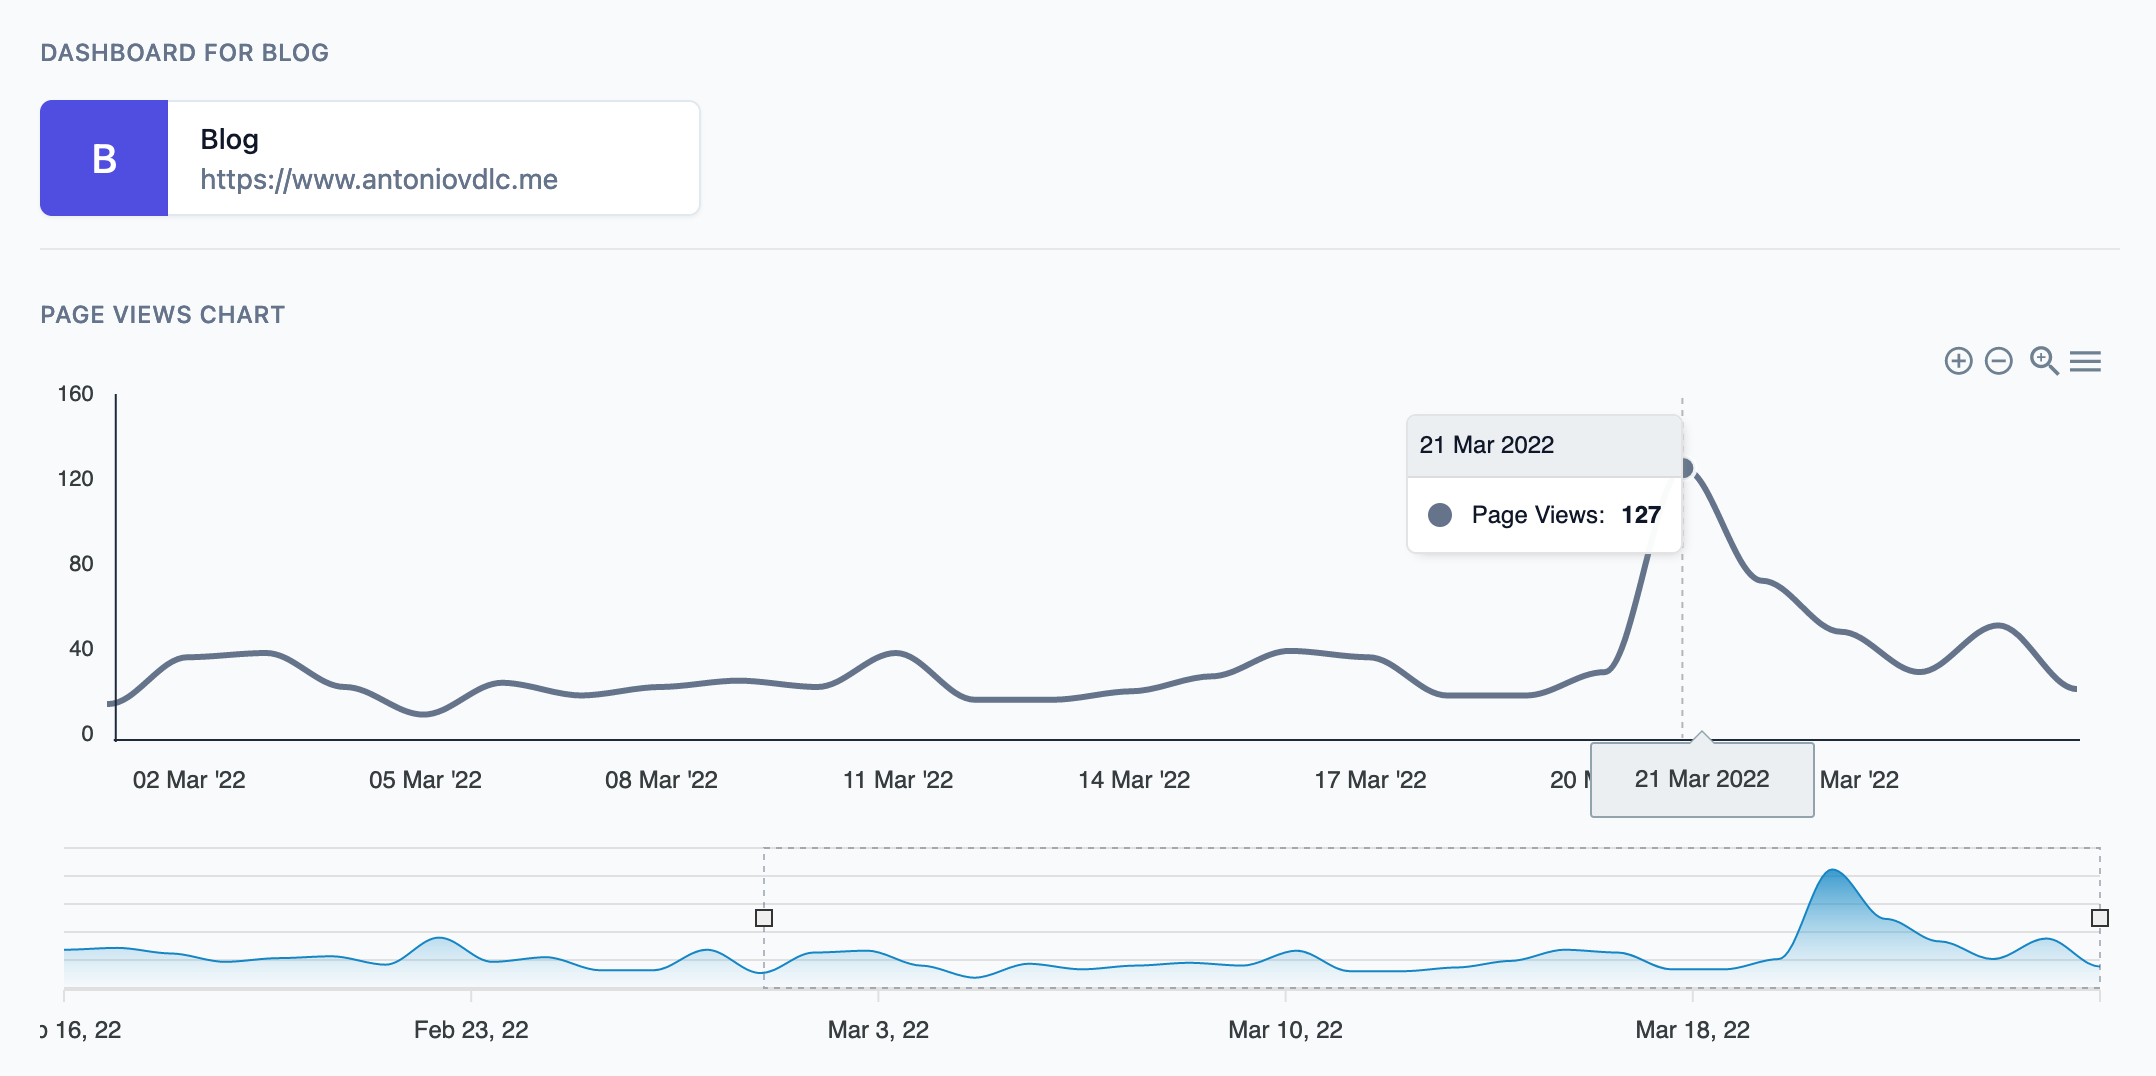
Even though the aggregation on the database is done in an hourly basis, the data is displayed in aggregate for each day. Users can select a time frame in the lower graph. They can also download the graph as an image, and the underlying data as a CSV.
Below the graph, the data is presented in segments. Those are the segments that were defined in the data model: date, path, browser, platform, referrer, etc...
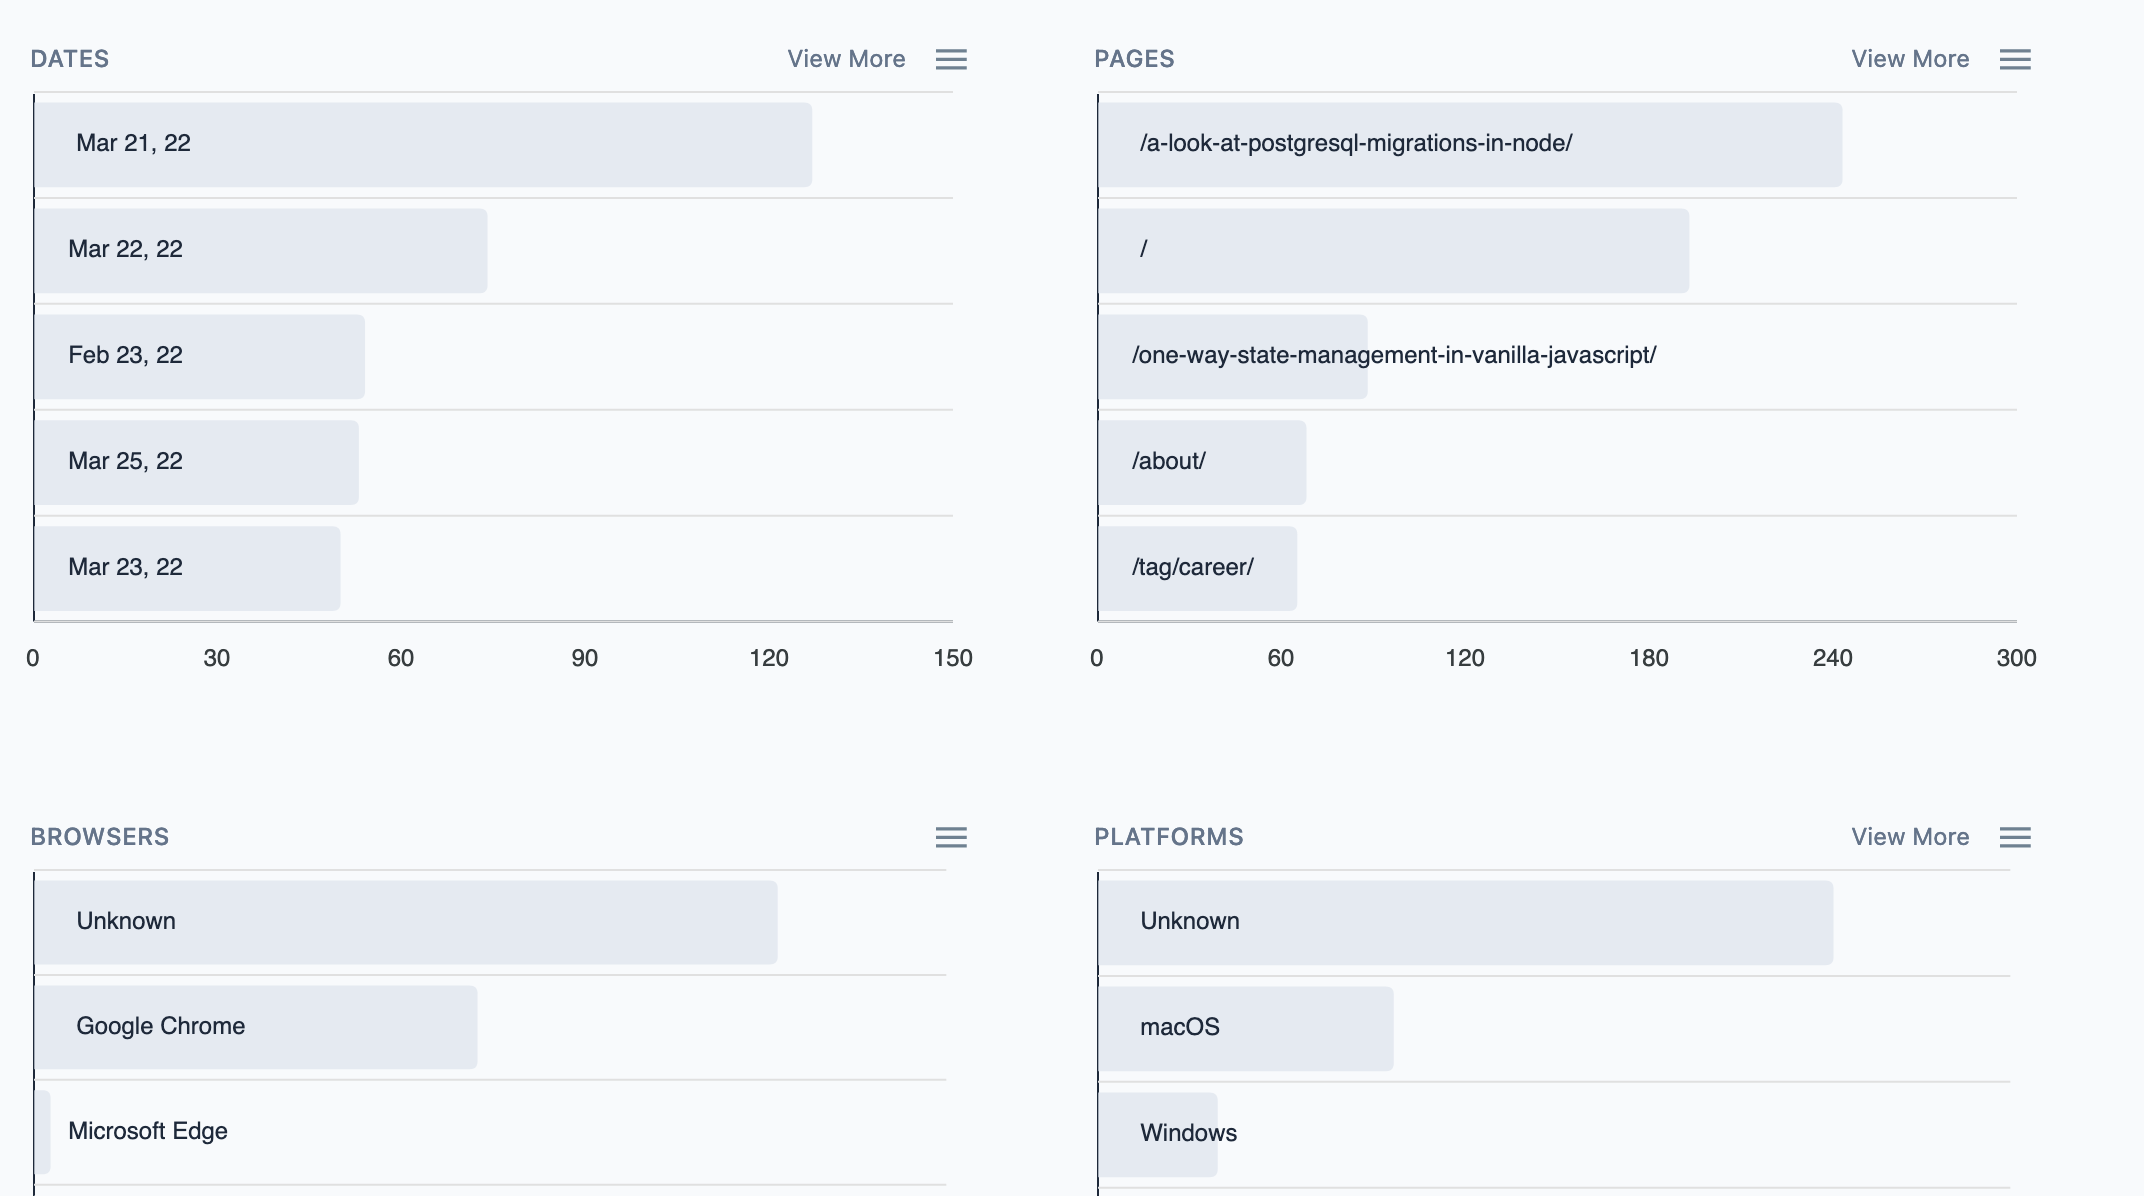
Only the top 5 entries are displayed by default, but that can be expanded by clicking on View more. Users can also download the underlying data.
Clicking on any of those items filters the graph by that segment and value. For example, hereafter is the graph of page views on my blog that came from a macOS device:
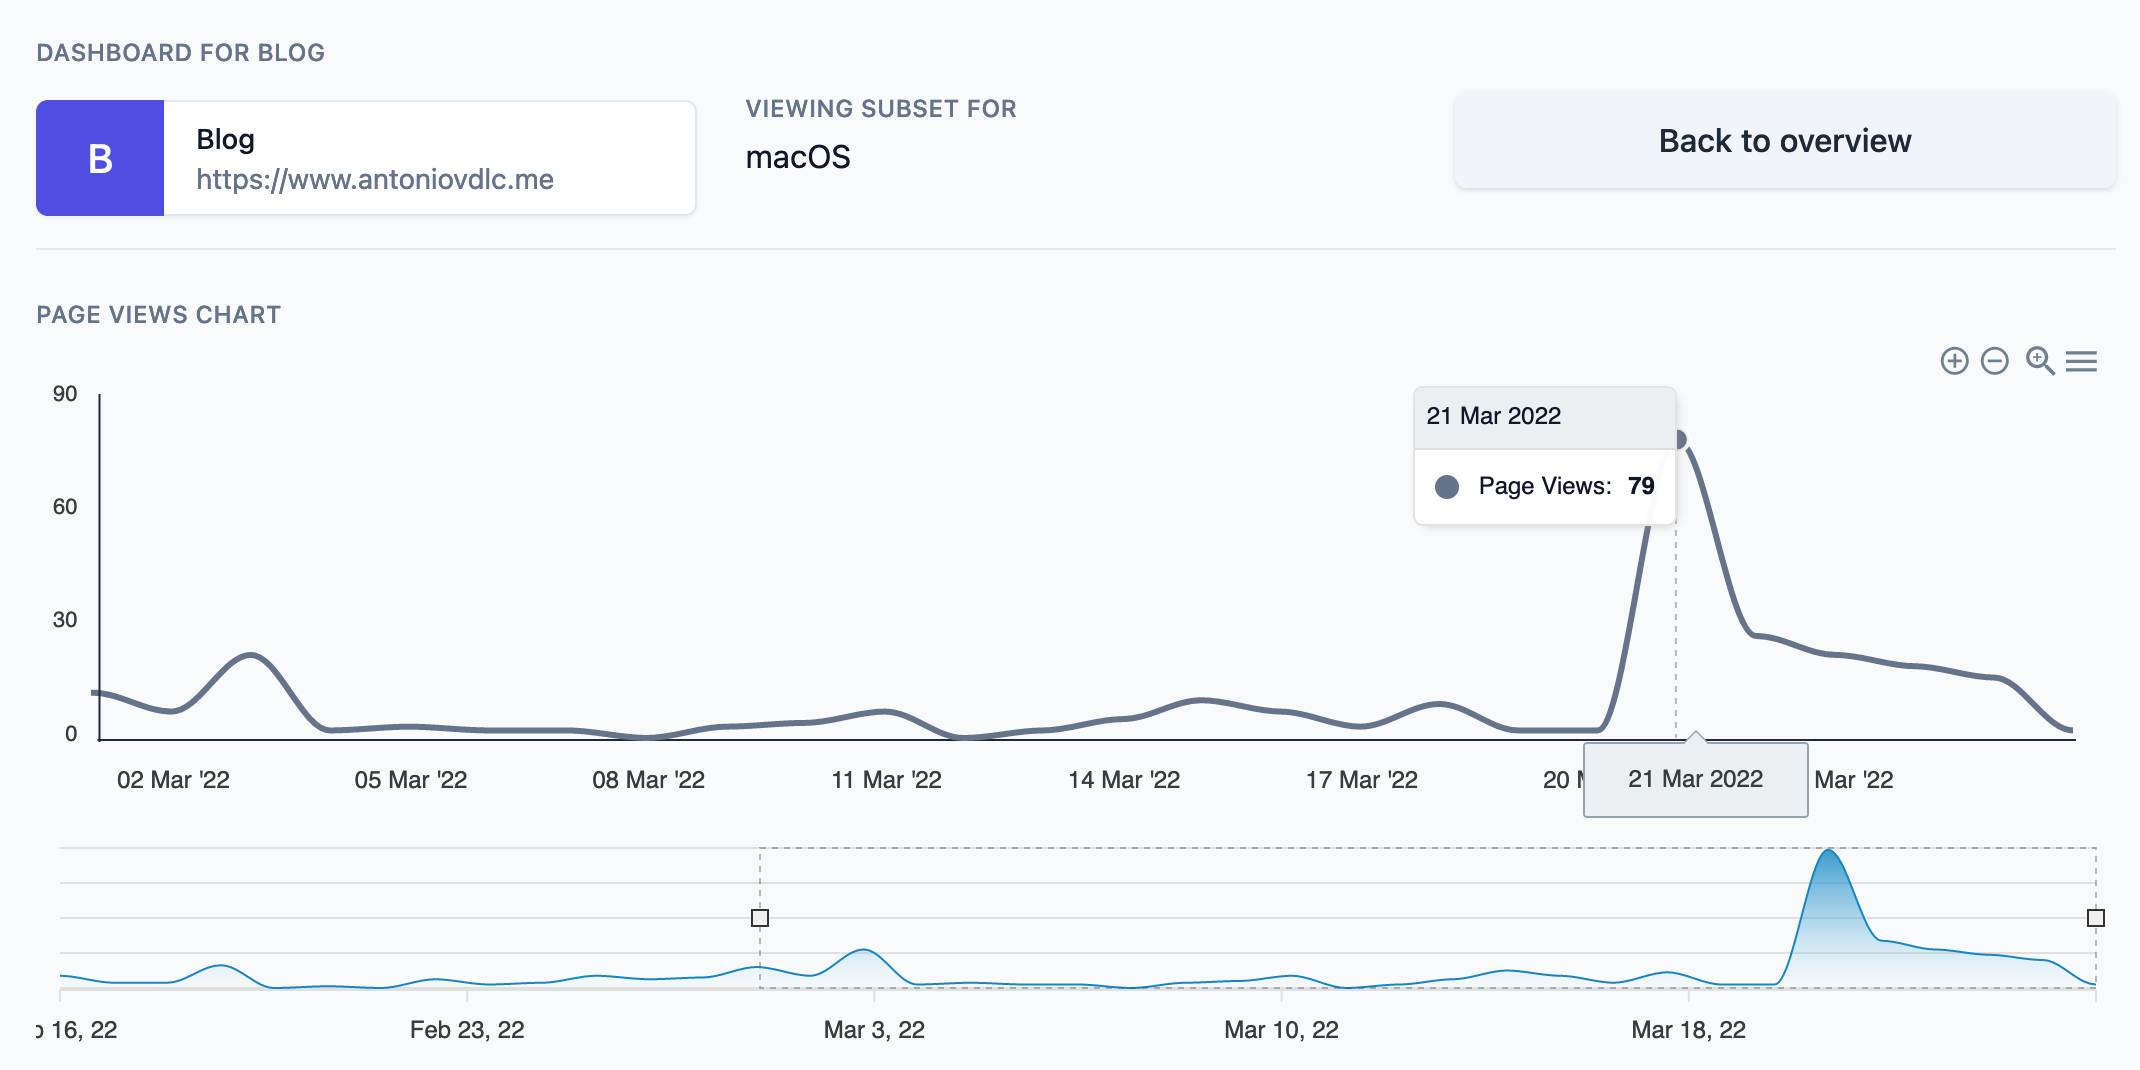
Currently, the filtering can only be done on a single segment and value, but the architecture should allow for it to be a lot more flexible and support multiple simultaneous segments and values.
Next steps
The platform is running live at https://fantomely.com, and the code base is open source and accessible on GitHub at https://github.com/AntonioVdlC/fantomely. It is currently being used to track page views on my blog, and on the https://fantomely.com website itself. If you'd like to have access to the platform, you can input your email on the landing page. I regularly go over the access requests.
Before making the platform generally available, there are a few milestones that I'd like to reach, such as adding subscriptions, handling plans, and allowing for organizations. Besides, there are also a few bugs I'll like to get on top of. Another feature that is probably going to come soon after as well will be the possibility to send custom events. Of course, you are more than welcome to contribute if you'd like, as the code is open source.
All in all, this has been a fun exercise, and it has already been useful to me. I hope that you found this article or the platform itself interesting.
That's all folks!